Notebook Demo#
[5]:
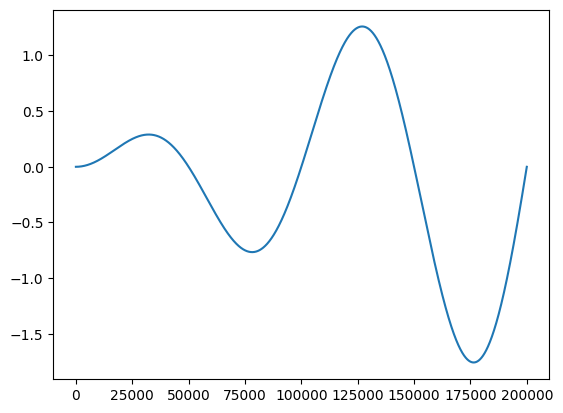
import matplotlib.pyplot as plt
import numpy as np
x = np.arange(0,10,0.00001)
y = x*np.sin(2*np.pi*x)
plt.plot(y)
plt.show()
[11]:
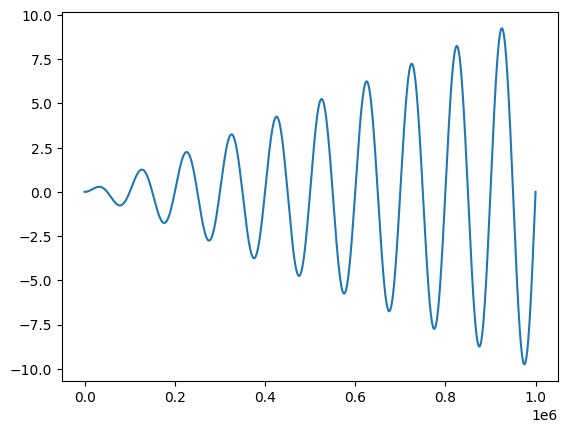
def draw(steps):
    x = np.arange(0,steps,0.00001)
    y = x*np.sin(2*np.pi*x)
    plt.plot(y)
    plt.show()
[15]:
draw(2)